Diverging Life Expectancy
This is a policy memo assignment I completed in January 2023 for PP422: Data Science for Public Policy. My assignment was to write about a topic that I consider under-discussed and to support my argument with three data visualizations. I had a 1500 word limit. I have made minor edits to the original assignment to improve clarity and readability.
The United states is experiencing a life expectancy crisis.
The chart below follows life expectancy at birth among the 20 richest countries by median income. Life expectancy is a complex statistical artifact that measures “how long, on average, a newborn can expect to live, if current death rates do not change.” It is driven down when people die younger and up when people die older.1
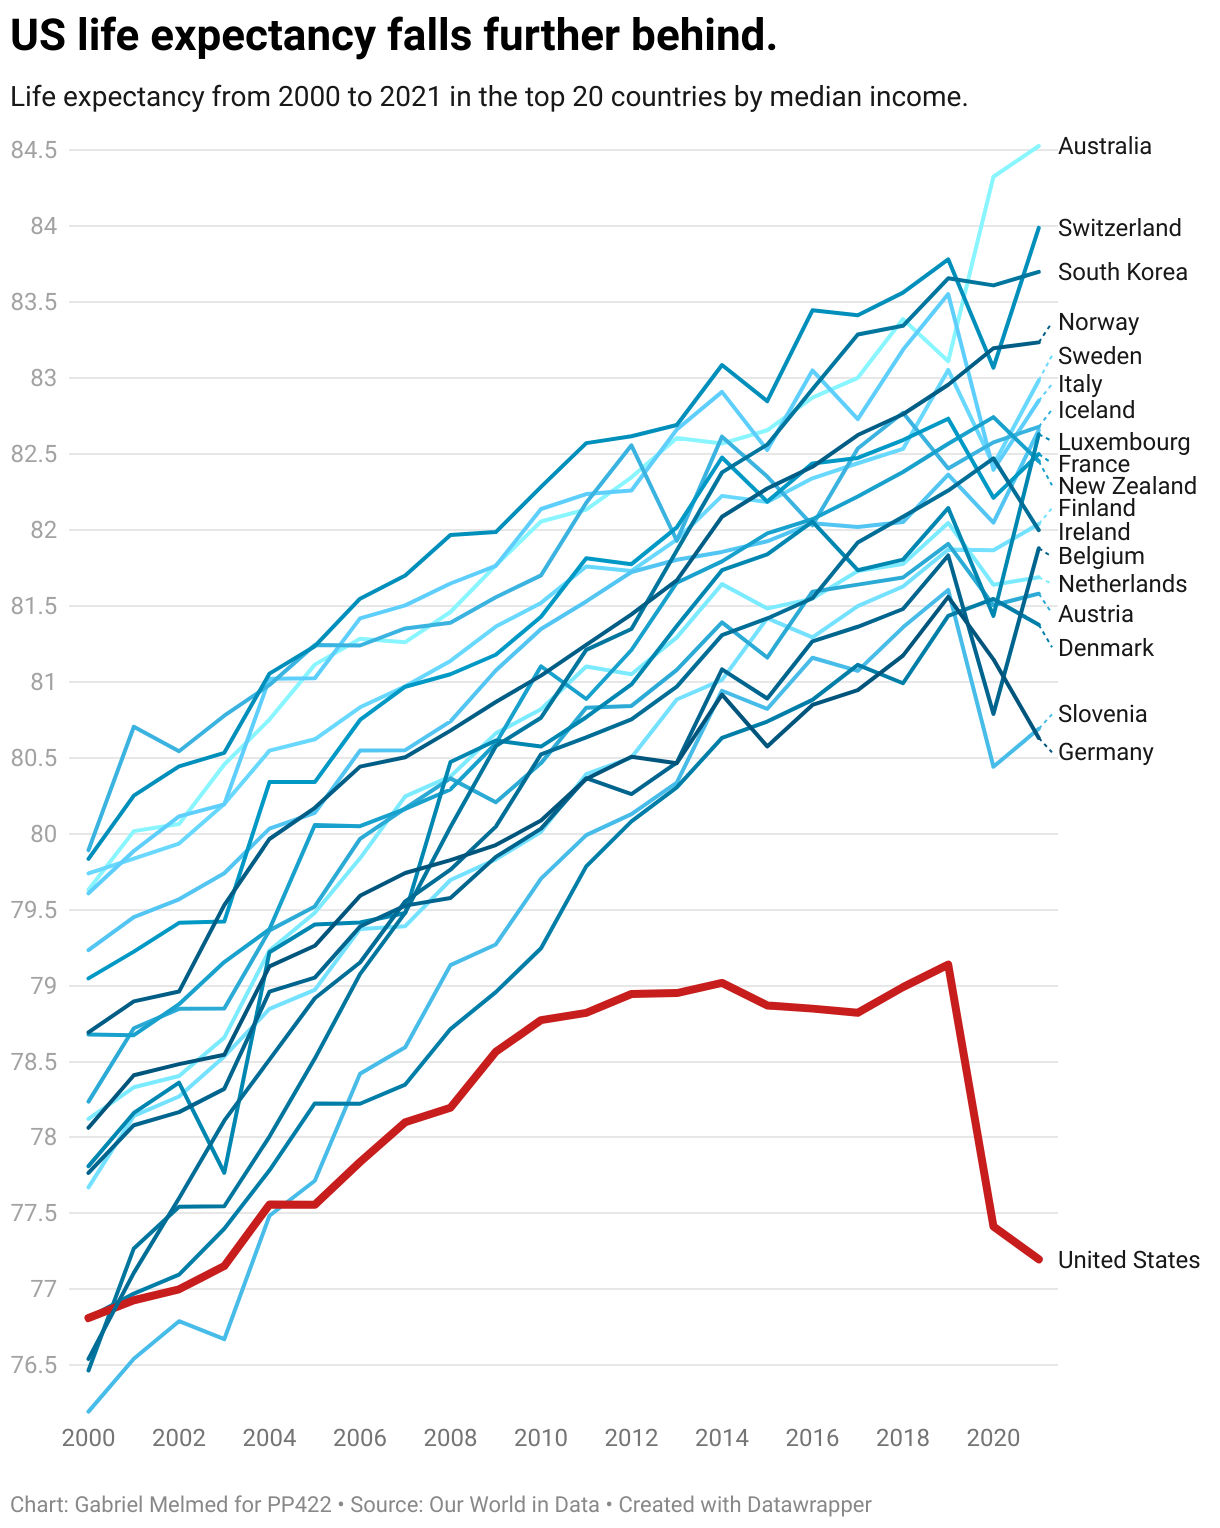
Despite the typical American being materially richer than her counterpart in almost every country in this group, she is expected to die earlier. Beginning around 2010, US life expectancy began to rise slowly compared to other high-income nations. It declined sharply compared to peer countries during the COVID-19 pandemic and has rebounded slower since the pandemic ended. The CDC’s provisional figures for 2022 indicate life expectancy has ticked up but remains below pre-COVID levels.
For the past two decades, public health experts have been attempting to raise the salience of America’s life expectancy crisis to little effect. Few national leaders have explicitly named the issue. President Biden has not mentioned the crisis in any public remarks. Some members of congress have proposed declaring a national crisis, but they are a small minority.
This memo makes two points. First, America’s under-performing life expectancy is not an overall trend, rather a reflection of a decline in outcomes for America’s lower class. Second, the life expectancy gap is explained by four main factors: obesity-related chronic conditions, the opioid epidemic, gun violence, and motor vehicle deaths.
Divergence, not Stagnation
National-level statistics can be misleading – they often obscure divides between regions and subgroups in a population. This is the case with US life expectancy. Looking at the US’s overall life expectancy, one might think life expectancy is stagnating for all Americans as it increases in other rich countries. When we examine county-level data from The Institute for Health Metrics and Evaluation’s Global Health Data Exchange (Henceforth IHME and GHDX), we see life expectancy is not stagnating but diverging. There is a large and growing gap between the longest- and shortest-living Americans. The map below shows US counties by the change in their life expectancy from 2000 to 2019.
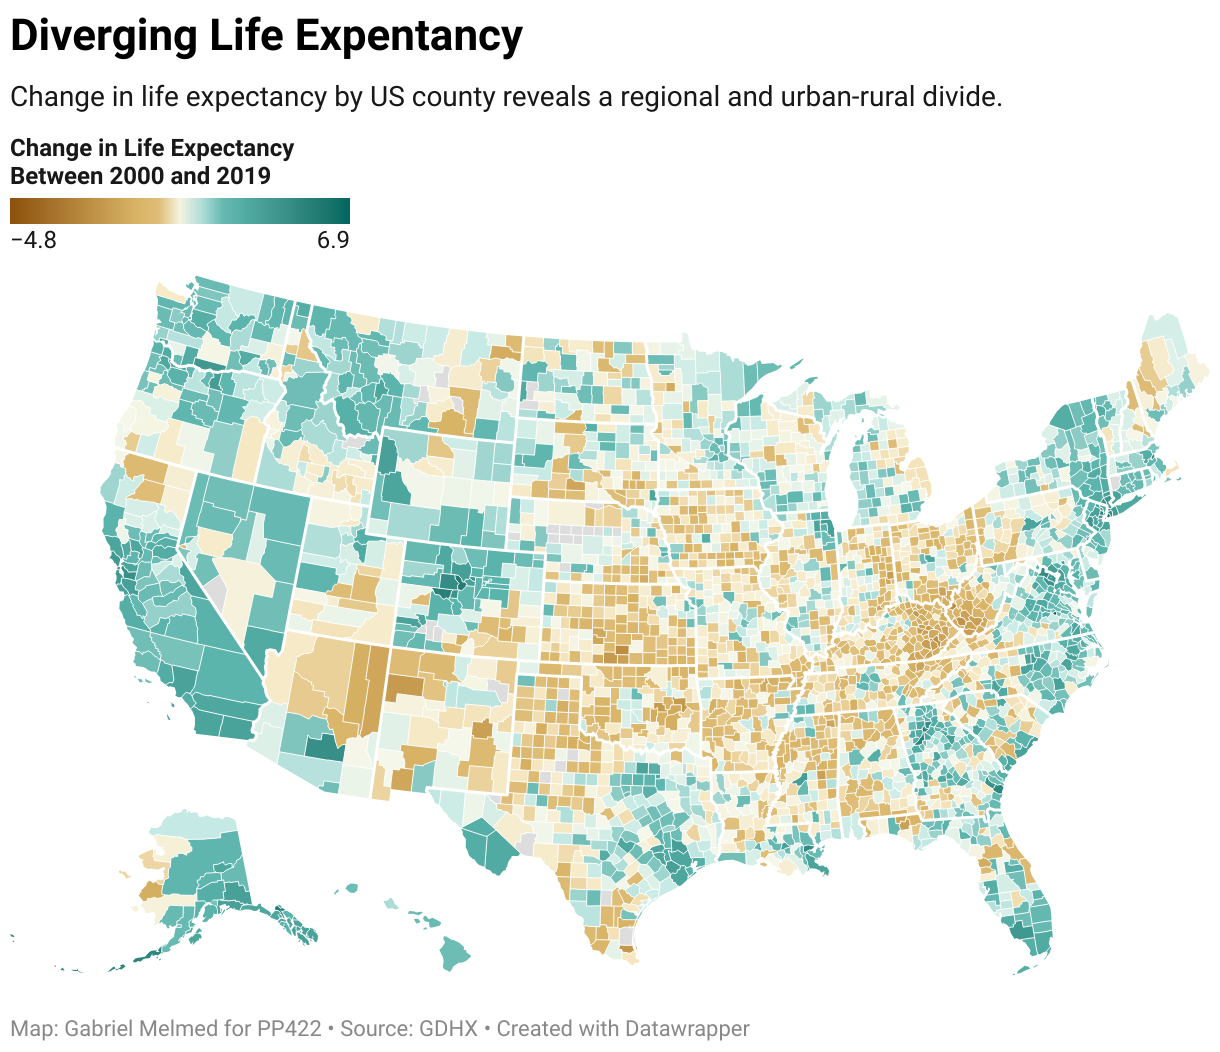
This map reveals an urban-rural divide. the counties that lost years of life expectancy are overwhelmingly in rural areas (with the notable exception of the mountain west). Meanwhile urban counties tended to gain years (the largest increase was recorded by New York County, NY). Life expectancy also reveals regional inequality - improving counties tend to be in urban areas in coastal regions while declining counties are concentrated in the Midwest and Appalachian regions. If American policymakers are to tackle the country’s life expectancy crisis, they must focus attention, personnel, and resources in these areas.
As one may infer from the map above, life expectancy is also highly correlated with income. When Chetty et. Al. 2016 compared tax records to death records from 1999 to 2016, they revealed “higher income was associated with greater longevity throughout the income distribution.” The authors also found “differences in life expectancy across income groups increased over time."
Life expectancy gaps between the rich and poor are to be expected in any country, but they are especially large in the US. The gap between the richest and poorest Americans is far larger than the gap between the richest and poorest Europeans. This is especially true for Black Americans.
Other researchers have focused on education-based mortality gaps. Novosad et. Al. 2022 examined mortality changes at constant education percentiles. They found from 1992 to 2018, the least educated 10% of Americans (read: high-school dropouts) have faced “catastrophic" increases in early mortality while mortality in other education bands stagnated or decreased.
COVID-19 accounted for a sharp life expectancy reduction in virtually all countries, including the US.2 COVID infections, hospitalizations, and deaths all diverged sharply by class – wealthier Americans with remote-compatible jobs were able to stay home and avoid infection. After the introduction of COVID vaccines, rural Americans were vaccinated at far lower rates than urban Americans, compounding the urban-rural expectancy gap.
Underperforming life expectancy is not a nationwide issue but a sign of inequality and neglect – the US is failing to ensure its rural, poor, and less educated citizens live long and healthy lives.
The Causes
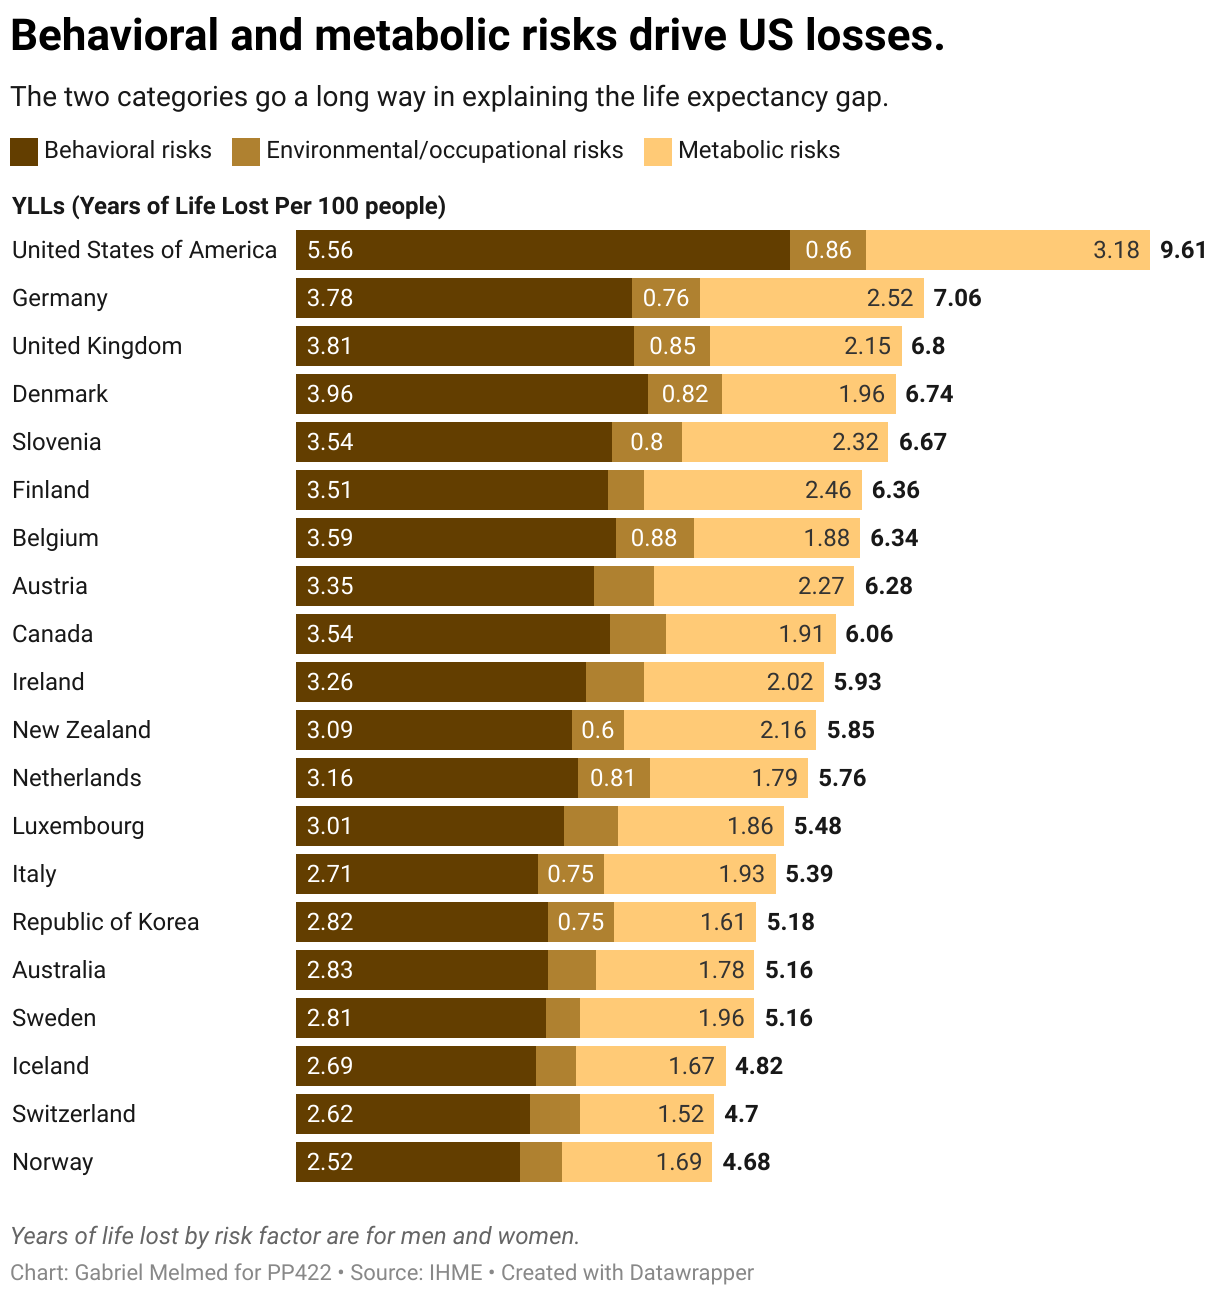
There is no single cause for the US’s under-performing life expectancy. The figure represents a culmination of several factors related to Americans’ health, wellbeing, and safety. The chart below uses GHDX data to compare age-standardized years of life lost due to different risk factors in 2019 in the same set of 20 rich countries from the chart above. Risk factors include behavioral (which include tobacco, alcohol, and substance abuse), environmental (unclean air and water, occupational hazards), and metabolic risks (mostly related to obesity). We can see the gap between the US and peer countries is driven primarily by behavioral and metabolic risks. While analysts debate the relative gravity of individual factors, a consensus has emerged that the US’s life expectancy under-performs due to four main factors: (i) obesity and its attendant chronic conditions, (ii) the opioid epidemic, (iii) gun violence, and (iv) motor vehicle deaths. The latter two are not captured by the risk factors in the chart, so the gap shown below is likely an underestimate.
Obesity and Chronic Conditions
In 2005, a team of researchers warned in the New England journal of medicine that increases in US obesity could halt decades of progress in life expectancy. A recent analysis from the Washington Post finds chronic conditions such as heart disease, diabetes, hypertension, liver disease, and kidney disease (all of which are highly correlated with obesity) “erase more than twice as many years of life among people younger than 65 as all the overdoses, homicides, suicides and car accidents combined.”
The US is an extreme outlier in obesity among rich nations. This is driven in large part by food deserts, which lead to highly unhealthy diets and are concentrated in the poor and rural areas highlighted above.
Substance Abuse
Breaking down the behavioral risks shown in figure 3, we see the gap in years of life lost due to behavioral risks is driven primarily by drug use. For the past two decades, the US has experienced an opioid epidemic. This epidemic has concentrated in the regions with declining life expectancy shown above. Glei and Preston 2020 estimate that from 1998 to 2016, drug use reduced male expectancy by 1.4 years and female expectancy by 0.7. In West Virginia, the most affected state, reductions were 3.6 and 1.9 years.
Gun Violence
In addition to COVID-19, gun violence accounted for the sharp decline in life expectancy in 2020 and 2021. Homicides spiked in the US during these years. Even before the recent spike, the US was an outlier in firearm-related deaths. Kalesan et. Al. 2018 estimate that gun violence accounts for 21% of the male life expectancy gap between the US and other high-income countries. Breaking the data down by race, they find the gap is especially large for Black men.
Motor Vehicle Deaths
Among rich countries, the US is an outlier in road fatalities per capita. This is for several reasons. American cars tend to be far larger than cars in peer countries, resulting in more pedestrian deaths. A greater share of Americans self-reported speeding and driving without a seatbelt than in peer countries. Furthermore, the built environment in American municipalities makes driving the dominant form of transportation. Not only does this lead to more road fatalities through increased driving, but it also leads to a less active lifestyle in general.
Conclusion
Life expectancy reflects a convergence of policy outcomes affecting lower-class Americans. Fortunately, the origins of this crisis are no great mystery. We know the main factors driving the crisis. Obesity-related chronic conditions, opioids, gun violence, and motor vehicle deaths leave little to be explained. Unfortunately, these are all disparate issues, each with complex and politically fraught solutions.